A Tale of Two States: Economic Recovery in Massachusetts vs New Hampshire
October 2015
Joshua Elliott-Traficante
Summary[i]: Despite historically leading the region out of recessions, the New Hampshire has become a laggard in comparison to Massachusetts. While Massachusetts recovered from the recession in terms of both employment and job numbers more than two years ago, only as of June 2015 has New Hampshire done the same. If New Hampshire had matched Massachusetts’s recovery speed, there would be 27,000 additional jobs in the state today. This piece looks at three work force metrics: the number of jobs in the state, the number employed residents, and the size of the labor force.
Jobs:[ii]
Proportionally, both New Hampshire and Massachusetts lost roughly the same amount of jobs in the last recession. Massachusetts hit bottom first in October 2009, with the total number of jobs in the state falling by just over 4 percent. New Hampshire reached its lowest point a few months later in January 2010 and lost just over 4.6% of its jobs. There the similarities end.
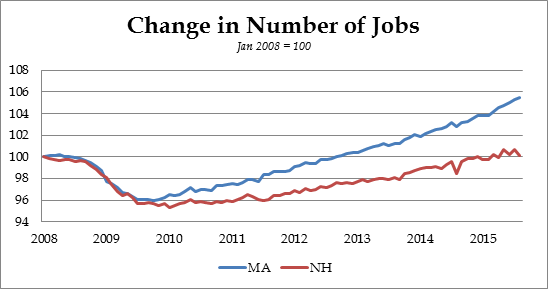
After hitting bottom, Massachusetts experienced a job creation growth rate averaging 1.6% per year, over the last five and a half years, far outpacing New Hampshire’s .9% per year average. While a .7 percentage point difference in growth does not sound like much, compounded over five and half years yields the yawning gap seen in the chart above. With that higher growth rate, Massachusetts was able regain all of the jobs lost in the recession by September 2012. New Hampshire on the other hand needed an additional two and a half years to recover all of the jobs lost. The state did crest prerecession levels in both December 2014 and March 2015, only for it to fall back below in the following month. Only as of June 2015 have job numbers stated above prerecession levels for more than a single month. If New Hampshire experienced the same growth rate in job creation Massachusetts did, there would be an additional 27,000 jobs in the state today.
Employment:
In terms of employment, which measures the number of state residents that have jobs (regardless of where the job is located), New Hampshire made out slightly better than Massachusetts did in the recession, experiencing less severe losses on a percentage basis.

Despite losing more proportionally, Massachusetts recovered faster, averaging growth of 1.4% per year, and returned to its pre-recession employment level in June 2013. New Hampshire however, only averaged .66% growth per year. That lower growth rate meant New Hampshire only returned to its pre-recession level of employment in February 2015, nearly two years after Massachusetts. The fact that the number of employed returned to prerecession levels before the number of jobs after Massachusetts did, indicates more people are commuting to other states for work than they did before the recession.
Labor Force:
With the mediocrity of the recovery, many analysts have used changes in the size of the labor force as a better measure of the general labor situation because the traditional unemployment rate fails to account for those who have given up looking for work. Although mild by national standards, both New Hampshire and Massachusetts saw declines in their respective labor forces as first the recession and then the mediocre recovery wore on. After hitting their lowest points in Spring 2011, both states saw minor albeit steady improvements.

Massachusetts returned to its prerecession high in March 2012 and saw accelerating growth beginning in late 2013 that continues to the present. New Hampshire’s Labor Force largely held steady and only recovered fully in May 2015. In recent months however, New Hampshire has experienced sustained growth, though not nearly as dramatic as south of the border. Some of this slow recovery in Labor Force growth is connecting to the ageing of the state, but the recent growth spurt in the last few months shows that this is not the dominant factor.
More Commuters?
With those upticks in Labor Force and Employment growth rates, it would seem as though New Hampshire is finally experiencing real economic growth. Unfortunately that does not seem to be the case. That growth in the Labor Force over the last 11 months represents more than 7,000 additional New Hampshire residents actively searching for work, with the number Employed growing by roughly 10,500. That means both those new entrants into the Labor Force and people who are currently unemployed are finding work. However, there is only a muted corresponding increase in the Jobs numbers, which only increased by 3,600 over the same eleven months. What accounts for these ‘missing jobs?’ Even when taking into account the self-employed and agricultural workers[iii] the difference between Job creation and Employment growth means upwards of half of the newly employed are finding work in another state, likely Massachusetts.
Conclusion:
While it is tempting to judge a state’s economic health based on the unemployment rate alone, doing so can be misleading. New Hampshire has an incredibly low unemployment rate, but it only just recovered all of the jobs lost in the recession. In contrast, Massachusetts has seen strong job growth, propelling it back to precession levels two and a half years before New Hampshire. Had New Hampshire simply replicated this growth rate, there would be more than 27,000 additional jobs in the state. Despite the recent improvements over the last nine months in both Labor Force and Employment numbers, the lack of a corresponding increase in Job numbers indicates more people are commuting out of state for work. Given Massachusetts’s growth it is likely that most of those new commuters found work there.
If Massachusetts, a state that lost a congressional seat in 2010 because its population was not growing fast enough, and that has notoriously difficult regulations and high taxes can both increase their labor force and add jobs, New Hampshire can certainly do better.
Click here to download a pdf version of this paper
[i] All data used in this piece was taken from the Bureau of Labor Statistics Establishment Survey (Jobs) and Household Survey (Employment and Labor Force) for New Hampshire and Massachusetts.
[ii] Jobs vs Employment: ‘Jobs’ counts the number of paid positions based on where they are located. Employment’ counts the number of people employed based on where they live. The employment figure for New Hampshire counts every state resident that has a job, regardless of where the job is located, while the jobs figure for New Hampshire counts the number of jobs based here, regardless of who fills it. For example, someone who lives in New Hampshire, but works in Massachusetts, would show up in the New Hampshire employment number, but their job would be counted in the Massachusetts job number. The Labor Force measures all of the people either employed or looking for work.
[iii] Both the self-employed and those who work on farms are not counted in the Jobs survey, but are counted in the Employment survey. It is possible that all of those ‘missing’ jobs in the last eleven months are people who started their own businesses or found agricultural work in the state. However, there is no evidence of a very quiet boom in either farming or self-employment, so this does not seem to be the case.
Trackbacks & Pingbacks
[…] A Tale of Two States: Economic Recovery in Massachusetts vs New Hampshire […]
[…] recently released unemployment rate of 3.4 percent is well below Massachusetts’ 4.7 percent, but a recent study paints a different picture of job growth in the two […]
Comments are closed.